PicoLog data acquisition software is a powerful but flexible program for collecting, analysing and displaying data.
PicoLog can be used with the following product ranges:
- Collect up to 1 million samples
- Easy and intuitive to use
- Free upgrades and technical support
- Supports 32- and 64-bit# editions of Windows XP (SP2 and above), Vista and Windows 7
- Compatible with Pico Data Loggers (except EnviroMon), and PicoScope 2000 Series USB Oscilloscopes
- International language versions
- Easy to set up and use with online help
- Real time data collection, analysis and display
- Programmable alarm limits can be set for each channel
- Data can be exported to spreadsheets and databases
- Save multiple setups for different tests and experiments
- Can be used with desktop or laptop PCs
- Supports multiple loggers on the same PC
- Uses PC monitor to give large colour display, ideal for education and training
- Waveforms can be saved, printed, faxed or e-mailed from your PC
# 64-bit support is only available for USB products
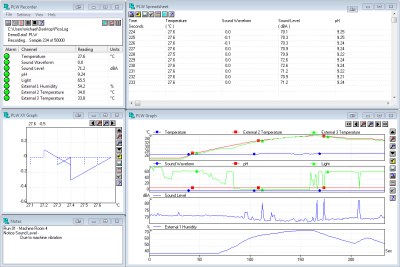
Multiple views
PicoLog displays data in a number of views, which can be activated as and when required. These views can be activated both during and after data collection.
Recorder View
Enables you to start/stop recording and specify recording files. It shows the current readings and alarm conditions for each channel. All settings such as scaling, channels and sampling are controlled from the recorder view.
XY graph view
Displays one parameter against another. Useful for plotting voltage against current, for example.
Spreadsheet View
Displays text data in a format that can be easily ‘copied and pasted’ into other applications. Data can also be saved to disk in standard ASCII text format.
Graph View
Graphs can be displayed both during and after data collection. Each channel can be displayed in its own graph or multiple channels can be displayed in the same graph. Axes can be set up manually, automatically or in chart recorder mode. Multipliers allow you to magnify areas of interest. Graphs can be ‘copied’ into the clipboard and then ‘pasted’ into reports.
Notes View
Notes view allows you to attach notes to data.
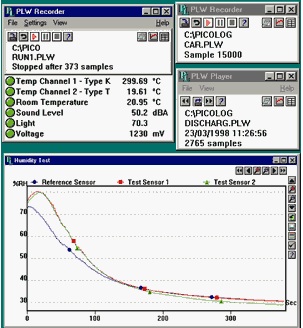
Player View
Displays previously recorded data. It enables you to scroll quickly through stored files to compare results on successive runs. The player can be used to examine old data whilst new data is still being recorded.
Program modes
PicoLog for Windows works in two modes: player mode for displaying previously recorded data and recorder mode for recording new data. You can have more than one copy of PicoLog for Windows running at once, so you can use the player to analyse old data whilst recording new data.
PicoLog can collect data from multiple converters at the same time. This not only allows a mix of voltage input units to be used on the same PC, but also allows other PC-based instruments such as the TC-08 Thermocouple Data Logger and the PicoScope 2203 USB Oscilloscope to be used at the same time.
Exporting Data
Data can easily be transferred (either as graphs or raw data) to other Windows applications by using the clipboard (copy and paste). Graphs can also be saved to disk (as Windows Metafiles) and data from the spreadsheet can be saved in text format. Current readings can be transferred using Dynamic Data Exchange (DDE). PicoLog also supports IP networking so it is possible to transfer measurements from a remote site via an existing LAN, company network, or even over the Internet.
Useful Features
Parameter Scaling can be used to convert raw data into standard engineering units. A wide range of equation and table lookup scaling options are provided.
Additional parameters can be calculated, for example to calculate power output from a boiler you may need to multiply a flow reading from one channel with the temperature difference between two further channels.
Alarm Limits can be set for each channel to alert the user should a parameter go out of a specified range.
PicoLog data acquisition software supports IP networking. This enables remote data collection from Pico’s full range of data acquisition products.